Friday, February 8, 2013

CBO on the deficit

The last report by the Congressional Budget Office is a positive welcome development. It might even act as a force for the two parties to arrive at a "grand bargain". The following is from the US News.

*********************************************************************************


CBO Paints Rosier Economic Picture for 2013

Budget estimators predict better growth, lower debt

February 5, 2013
Congressional Budget Office Director Douglas Elmendorf gestures as he speaks during a news conference about the office's annual Budget and Economic Outlook at the Ford House Office Building on Feb. 5, 2013.
For the first time in five years, the government is projected to have a deficit below $1 trillion, the Congressional Budget Office reported on Tuesday.
But as with the last CBO estimate of the nation's budgetary and economic outlook, estimates could shift depending on what Congress does with spending and the economy.
The report estimates that under current law the fiscal year 2013 deficit will come in at $845 billion, or around 5.3 percent of GDP. That's about half of where the deficit was in 2009. But CBO adds that debt as a share of economic output would remain at "historically high" levels—around $12.2 trillion, or 76 percent of GDP at the end of fiscal year 2013. That's the highest share of GDP that the national debt will have been since 1950, according to the CBO.

As for the broader economy, the office has sharply improved its outlook. In August 2012, the CBO predicted that the U.S. economy would shrink by 0.5 percent in 2013, with unemployment hitting 9.1 percent at the end of the year. Now, the office projects growth of 1.4 percent this year, with unemployment at 8.0 percent at the end of the year.
Though better than previous estimates, CBO's predictions still represent a bleak outlook. If the economy only grows by 1.4 percent in 2013, that's a slowdown from around 1.9 percent in 2012. And if unemployment remains above 7 percent through 2014, as the office projects, it will be 6th consecutive year with the jobless rate above 7 percent. That will make it the longest period of sustained high unemployment 70 years, the CBO says.
CBO's director Doug Elmendorf told reporters at a Tuesday press briefing that full economic recovery could be a long time in coming.
"We expect output to remain below its potential level until 2017, almost a decade after the recession started in 2007," he said.


Still, all of these estimates are contingent upon what Congress does in the coming months. The sharply positive revisions are due in large part to Congress veering away from the so-called "fiscal cliff"—stopping tax hikes for most Americans and putting off until March across-the-board budget cuts totalling $1.2 trillion over 10 years.
Often criticized by congressional Republicans who say the CBO too often skews its findings to support Obama administration policies, its latest report argues that all of the projections are conditional upon what Congress decides to do about sequestration.
If lawmakers allow across-the-board cuts to medicare, defense and other discretionary spending—or if they fail to enact a long-term debt ceiling agreement or maintain government funding—CBO would likely have to revise down its estimated economic outlook, officials say.

Saturday, February 2, 2013

Job Discrimination?


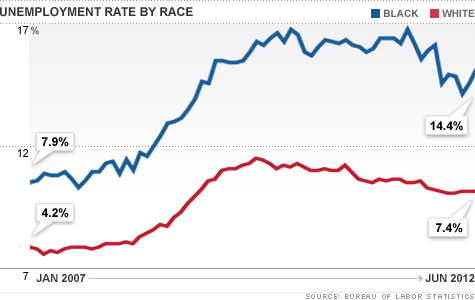
Although the Great Recession ended in 2009 the number of unemployed is still very high. As many of you know, there are many different metrics for measuring unemployment the most popular of which says that the US has currently a 7.9% unemployment rate.  That is estimated to be over 10 million people. To understand the significance of the above numbers one must keep in mind that the labour force in the US is currently estimated to grow at over 1 million every year i.e about 100,000 new jobs a year. At the present rate of creating 150,000 then it would take a long long time to make significant cuts into that reserve of unemployed. Sadly the African American population carries an unemployment burden that is far larger than its proportion in the population.

Scholars sketch bleak economic picture for black Americans

By Michael A. Fletcher, Published: February 1

Scholars gathered for the African American Economic Summit at Howard University on Friday sketched an alarming picture of the financial ills afflicting the black community even as the nation recovers from the recession.
The white-black wealth disparity is more than 20 to 1. Black homeownership has declined. Black joblessness is up. Black income is down.
As the conferees gathered, the government released new figures showing the black unemployment rate at 13.8 percent, nearly double the 7.0 percent for whites. The overall jobless rate is 7.9 percent.
As bleak as the economic picture is for black Americans, the immediate prospects for improving it are worse, many participants said. They agreed that chances are remote for the kind of aggressive, targeted action needed to combat those problems and close the economic disparities that have long separated blacks and whites.
“We are basically talking about an economic system that is shot through with discrimination,” said Bernard E. Anderson, a former assistant secretary of labor.
Despite that, Anderson and others said, President Obama seems reluctant to attack economic disparities between blacks and whites head-on.
Anderson said that Obama’s second inaugural address was notable for lifting up gay rights, sounding the call for immigration reform and signaling his determination for women to receive equal pay in the workplace. “But there was not a single, blessed word on race,” he said.
Anderson said that he has met with Obama’s economic advisers in years past, but did not get the sense that they were interested in any racially targeted economic remedies. “He does not want to be labeled a president who is consumed by racial inequality in this country,” Anderson said.
Others at the conference said that Obama took office during the worst downturn since the Great Depression and had his hands full forging policies to keep the economy from a full meltdown.
Meanwhile, administration officials have pointed out that the president’s policies have led to 35 consecutive months of private-sector job growth and more than 6 million new jobs. They also note that the president’s work to expand Pell Grants and extend the earned-income and child tax credits have helped millions of African Americans.
Nonetheless, conferees said that more needs to be done to close the racial disparities that have long been a feature of the nation’s economic life.
During the depths of the crisis, Obama often said he wanted to build a better, more durable economy in the recovery. Conference participants said they are challenging him to live up to his word.
“We would all like to see him pursue that course,” said Ralph B. Everette, president and chief executive of the Joint Center for Political and Economic Studies, which co-sponsored the event.
Several scholars offered far-reaching, if politically unlikely, policy prescriptions.
Duke University professor William A. Darity Jr. said policymakers should pursue a large-scale public jobs program to dramatically lower unemployment. Darrick Hamilton, an economist at the New School, said the government should divert some of the money used to fund the income-tax deduction for mortgage interest to fund “baby bonds” that would provide $15,000 for disadvantaged newborns of any race to invest later in higher education, a business or a home.
The remedies need to be bold because “racial disparities are persistent and they are ubiquitous,” said Enrique A. Lopezlira, a lecturer at Howard. “It is hard to explain in a context that does not include some sort of institutional racism going on.”

Sunday, January 27, 2013

Effective Tax Brackets


So you think that the latest compromise over the fiscal cliff has increased the tax rate on the rich while it kept the rate unchanged for the rest? Well, think again. The following is the latest estimate by the Tax Institute of the expected effect of the new legislation once everything is taken into consideration. The effective tax rates are expected to look as such:

A greater breakdown of the calculations would reveal what many are not aware of:
65% of the Federal Income Taxes are paid by the top 20% of the tax payers while the bottom 20% pay only 2.4% of the Federal Income Taxes. Is such an inequality in income distribution sustainable?

Bottom fifth: 1.9
Second fifth: 9.5
Middle fifth: 15.6
Fourth fifth: 19.0
Top fifth: 28.1

80-90 percentile: 21.5
90-95 percentile: 23.4
95-99 percentile: 26.3
Top 1 percent: 36.9

Top 0.1 percent: 39.6

Wednesday, January 23, 2013

Are Labour Unions Effective?


At the dawn of the 20th century, heavy industry and big business were in their infancy and a great deal of human labor was needed in order to facilitate the mushrooming Industrial Revolution. This quickly led to widespread abuse of workers, including children, who were often consigned to sweatshops where they were forced to toil for several hours a day. However, workers eventually united to form labor unions that stood up to the big corporations and negotiated better pay and working conditions for millions of employees and also demanded the passing of child labor laws.The effectiveness of labor unions, however has always been a source of controversy.

Who Do Unions Benefit?Of course, labor unions were created for the benefit of their members. The union represents the workers to the employers and negotiates on their behalf to secure better wages and working conditions. Unions also run the largest non-military job training service in the country and often partner with organizations such as the United Way to perform various community services. Research that tracks the wages of unionized versus non-unionized employees indicates that the wages of union workers exceed that of non-union employees by about 8 to 12%.

Economic studies have also suggested, however, that much of the difference in pay and benefits that many union workers enjoy compared to non-union employees can no longer be attributed to the unions themselves. Modern union contracts make it more difficult for a company to fire an unproductive employee, so employers now tend to be much more selective in whom they hire, which has resulted in an increase in the quality of the union workforce as a whole. Many unions form for employers and industries that are larger and more stable financially because this allows the union to demand better wages and benefits.

Economic ImpactUnions can convince workers to join them as a means of preserving the unions' clout in industries (such as the U.S. auto industry). But history shows that this can cripple an industry, especially over time. Members of the UAW enjoy wages of about $70 an hour, a wage greater than that of many Ph.D. scientists. They also enjoy a whopping seven weeks of vacation per year for unskilled laborers. Foreign automakers came to the U.S. auto market in the 1970s and used non-union workers in the southern states to build vehicles. Due to the savings in labor costs, these foreign automakers could afford to sell their vehicles for less money. This made it much harder for the big three automakers to produce competitive cars at affordable prices for the public, and in 2008 Chrysler and GM were forced to declare bankruptcy.

CorruptionJimmy Hoffa gave millions of dollars of union pension money to the Las Vegas mob in the '60s and '70s, and elements of organized crime can muscle into local labor unions and take jobs and other benefits from working members. Some unions are not above using strongarm tactics to protect their territories, as the International Longshore and Warehouse Union proved in September of 2010 when it attacked a railroad dock terminal, overpowered security guards and sabotaged trains carrying grain for a company that tried to use a different labor union.
The Bottom LineRegardless of their effectiveness, labor unions have played a major role in workers' rights and the economies of America and other capitalist countries. Although some economists say that unions have outlived their usefulness, they will likely continue to impact our industries and other sectors of the economy one way or another for decades to come.

Saturday, November 10, 2012

The Micreconomics of Green Jobs


Much fuss has been made about green jobs. Do they exist, and are more “brown” jobs displaced for every green one? Given all the political rhetoric, it’s not surprising that there is also considerable confusion about green jobs.
BERKELEY, CA - FEBRUARY 16:  A job seeker look...
                      Image by Getty Images via @daylife

There should not be. While pinpointing the actual number of jobs created or destroyed by any particular policy will always be fraught, the underlying microeconomics are rather simple, and understanding those microeconomics can make it clear if a given policy will be a net creator or destroyer of jobs.
While there are many considerations that should be taken into account when forming policy, such as encouraging new technology which may allow future growth, and improving the health and well-being of citizens, I am going to restrict myself to the goal of promoting job creation and economic activity in this article in order to keep the discussion relatively simple.
Re-framing the Question
In order to avoid the rather pointless debate about the definition of a “green job” I will re-frame the question to one that I believe both sides would agree is more important (at least if they were able to put aside partisan bickering):
Does a particular green policy create more jobs than it destroys?
If a policy is both green (which I define as lowering our use of resources and/or environmental impact) and is a net creator of jobs, all parties should agree that it is a good policy. Green policies which destroy jobs, on the other hand will require further analysis as to whether the environmental and health benefits outweigh the economic losses, a question which requires putting relative value on various benefits, and cannot be resolved purely by economic reasoning.
Which Policies are Net Job Creators?
I’m aware of two mechanisms by which a policy can increase or decrease economic activity and hence number of jobs.
  1. Jobs can be created or destroyed by substituting labor for capital, energy, and/or other resources in production.
  2. If a policy increases economic efficiency, it will increase economic activity and create jobs. If it decreases economic efficiency, it will reduce economic activity and destroy jobs.
Substituting Labor for Energy or Capital
Marginal rate of Technical Substitution.
Image Source: Wikipedia
A basic tenet of microeconomics says that there is a tradeoff between capital, labor and natural resources such as energy in the production function. In particular, you can substitute capital for labor (by mechanization) or labor for capital (by using shovels and picks instead of bulldozers.) Now add energy into the mix, and you can substitute fossil energy for either capital or labor to attain the same production.
For example, a hybrid vehicle substitutes capital and resources (in the form of an electric motor and batteries) for energy (less fuel consumed to do the same work.) A bus substitutes labor (the bus driver) for capital, resources and energy (lots of cars and fuel consumed.) A green building substitutes labor (better architecture/construction) and some resources (extra insulation) for energy.
From this perspective, any policy that promotes the substitution of labor for energy will create green jobs, since you get more work and less energy consumed. Shifting people out of their cars and onto mass transit will create jobs because there will have to be drivers and people managing the transit system, where before no one was paid to drive. To the extent that the transit system can be paid for out of the reduced fuel costs and car ownership costs of the former drivers turned riders, the number of jobs created will be a pure economic gain.

Multiplier Effects
That brings us to the other major potential source of jobs from green policies: economic multiplier effects.
To the extent that green policies improve economic efficiency by overcoming economic barriers to cost effective green solutions, these policies will result in greater economic activity, and hence more jobs. The strongest critique of “green jobs” initiatives is that they simply shift economic activity from out-of-favor “brown” sectors to more politically correct green ones. Yet when a policy improves economic efficiency, it does not just shift jobs and capital around in the economy: it creates economic activity and jobs.
Not all green policies improve economic efficiency. For example, subsidies for not-yet-economic types of renewable energy such as wave power and solar installations may be justifiable on the grounds that they are helping to promote needed future technologies, but they probably come at a net cost to near-term jobs (even if they may create more jobs in the long term by allowing the creation of new types of businesses.)
On the other hand, policies to promote energy efficiency will be strong net creators of jobs, because the cost of energy efficiency is typically only a fraction of the cost of the energy saved. The very existence of opportunities to save significantly on energy bills at modest cost is proof that the energy market is inefficient. In an efficient market, all such opportunities would have already been taken.
After the energy efficiency measure has been installed, the cost savings can be used for useful economic activity, rather than wasted on unneeded fuel. This money will then spur additional activity and stimulate jobs.
Using Fossil Resources to Stimulate Growth is Like Stimulating Growth With Debt
Short term jobs (green or otherwise) should not be the only consideration when forming policy. A short term focus on jobs today can end up doing long term economic harm. For instance, if we spend too much borrowed money to create jobs today, the long term drag on the economy caused by paying back the debt will leave everyone worse off.
Economic growth fueled by the extraction of non-renewable resources is very similar to economic growth fueled by debt. When we extract these resources and use them, we increase economic activity today, but their non-renewable nature means that we lose the opportunity to extract and use them tomorrow. Hence, the economic stimulus today comes at the cost of an economic drag tomorrow, and the future economic drag will generally be larger than today’s stimulus, since improving technology should allow us to get more benefit from each unit of resource in the future.
Using renewable resources to stimulate growth does not have this problem: Tapping the wind or the sun for energy today does nothing to diminish the wind or sun tomorrow. Hence, to the extent a green job relies on renewable resources and a brown job relies on fossil resources, the green job should be preferred, even before taking the environmental benefits into account.
Policy Implications
If we only consider job creation, the focus on policy should be on creating jobs and economic activity, with a preference for green jobs, since those impose less of a cost on future economic activity than jobs based on extractive industries.

Green jobs can be created either by substituting labor for energy and capital, or by reducing energy waste so that the money previously wasted on energy can be put to more productive uses. For policy makers who wish to create green jobs, the implications are clear.
Green job programs should focus on two types of opportunities:
  1. Industries where labor can usefully be substituted for energy or capital, such as mass transit.
  2. Breaking down the barriers to energy efficiency which can stimulate economic activity by allowing money that would otherwise have been wasted.
The converse is also true: if the goal is to create jobs and stimulate economic activity, subsidies and other policies which encourage the substitution of capital and energy for labor should be ended, especially those subsidies which encourage the extraction of non-renewable resources which only create jobs today at the cost of future jobs.
The most cost effective policies for creating jobs will be those that break down the barriers to the adoption of cost-effective green technologies, especially energy efficiency. Ironically, most energy subsidies have gone into capital intensive sectors such as nuclear and extractive sectors such as oil and gas.
A very cost effective way to produce jobs would then simply be to remove subsidies from fossil fuels and nuclear energy and redirect them towards the most cost effective clean technologies.
Increased support for and promotion of public transit could do much more to reduce our dependence on imported oil than support for domestic drilling (which will only make us more dependent on imported oil in the future by using up domestic resources sooner) while also creating jobs.
Meanwhile, energy efficiency programs such as cash for caulkers can cost-effectively reduce energy bills and free up money for other sorts of consumption while also creating jobs in the depressed housing sector.

(originally published in Forbes)

Saturday, October 20, 2012

For Richer For Poorer

As probably many of you know, there is a cloud hanging over the future of the US and many other countries, the cloud of wealth concentration. There is nothing in life that will not be affected by this phenomenon. It obviously affects our allocation of resources and  it will have tremendous influence on who gets what. It would affect the relations between the social classes and could lead to social unrest if we allow the fissure between the haves and have nots to increase. The following is only one part of an excellent article that speaks to this issue.

 *********************************************************

Growing inequality is one of the biggest social, economic and political challenges of our time. But it is not inevitable, says Zanny Minton Beddoes


IN 1889, AT the height of America’s first Gilded Age, George Vanderbilt II, grandson of the original railway magnate, set out to build a country estate in the Blue Ridge mountains of North Carolina. He hired the most prominent architect of the time, toured the chateaux of the Loire for inspiration, laid a railway to bring in limestone from Indiana and employed more than 1,000 labourers. Six years later “Biltmore” was completed. With 250 rooms spread over 175,000 square feet (16,000 square metres), the mansion was 300 times bigger than the average dwelling of its day. It had central heating, an indoor swimming pool, a bowling alley, lifts and an intercom system at a time when most American homes had neither electricity nor indoor plumbing.

A bit over a century later, America’s second Gilded Age has nothing quite like the Vanderbilt extravaganza. Bill Gates’s home near Seattle is full of high-tech gizmos, but, at 66,000 square feet, it is a mere 30 times bigger than the average modern American home. Disparities in wealth are less visible in Americans’ everyday lives today than they were a century ago. Even poor people have televisions, air conditioners and cars.
But appearances deceive. The democratisation of living standards has masked a dramatic concentration of incomes over the past 30 years, on a scale that matches, or even exceeds, the first Gilded Age. Including capital gains, the share of national income going to the richest 1% of Americans has doubled since 1980, from 10% to 20%, roughly where it was a century ago. Even more striking, the share going to the top 0.01%—some 16,000 families with an average income of $24m—has quadrupled, from just over 1% to almost 5%. That is a bigger slice of the national pie than the top 0.01% received 100 years ago.
This is an extraordinary development, and it is not confined to America. Many countries, including Britain, Canada, China, India and even egalitarian Sweden, have seen a rise in the share of national income taken by the top 1%. The numbers of the ultra-wealthy have soared around the globe. According to Forbes magazine’s rich list, America has some 421 billionaires, Russia 96, China 95 and India 48. The world’s richest man is a Mexican (Carlos Slim, worth some $69 billion). The world’s largest new house belongs to an Indian. Mukesh Ambani’s 27-storey skyscraper in Mumbai occupies 400,000 square feet, making it 1,300 times bigger than the average shack in the slums that surround it.

The concentration of wealth at the very top is part of a much broader rise in disparities all along the income distribution. The best-known way of measuring inequality is the Gini coefficient, named after an Italian statistician called Corrado Gini. It aggregates the gaps between people’s incomes into a single measure. If everyone in a group has the same income, the Gini coefficient is 0; if all income goes to one person, it is 1.
The level of inequality differs widely around the world. Emerging economies are more unequal than rich ones. Scandinavian countries have the smallest income disparities, with a Gini coefficient for disposable income of around 0.25. At the other end of the spectrum the world’s most unequal, such as South Africa, register Ginis of around 0.6. (Because of the way the scale is constructed, a modest-sounding difference in the Gini ratio implies a big difference in inequality.)

Sunday, October 7, 2012

Getting The Number Wrong

The following post is an attempt to explain the unemployment figures that were released last Friday.

Mitt Romney said on Friday that there were 23 million Americans struggling to find work. It looks as if he got that wrong, by engaging in a little double counting. The real number is around 21 million.
The just-released Labor Department report for September says there are 12,088,000 people classified as unemployed, meaning they looked for a job during the previous month and did not find one. That is the seasonally adjusted figure. The actual number the department estimated was 11,742,000.
There are no seasonally adjusted numbers for the other groups that could conceivably fit into the category — people not in the labor force who say they would like work if they could find it and people classified as “marginally attached” to the labor force.
There are 6,427,000 people counted as out of the labor force but wanting to work, and 2,517,000 classified as marginally attached.
Add them together, and use the higher (seasonally adjusted) figure for unemployment, and you get 21,032,000. If you were trying to be fair and compare apples to apples, you’d used all numbers before seasonal adjustment, and get 20,686,000.
Either way, that is a long way from 23 million.
So where did the rest come from? My guess is that Mr. Romney’s aides looked at Table A-16 of the release. That shows the 2,517,000 “marginally attached,” and breaks them into two groups. The first is 802,000 discouraged workers, and the rest — 1,715,000 — are classified as people who are deemed to be marginally attached but are not discouraged workers. That includes people who were ill or had school or family responsibilities that kept them from looking for work. If you add those two groups to the whole, then the number gets to be over 23 million. But that would represent a misreading of the figures.
Even if Mr. Romney had done his arithmetic correctly, it would be a stretch to say there were 21 million people “struggling to find work.” Of the 6.4 million who said they were not in the labor force but would work if they could, 3.3 million said they had not actually tried to find a job in the last year.