Much fuss has been made about green jobs. Do they exist,
and are more “brown” jobs displaced for every green one? Given all the
political rhetoric, it’s not surprising that there is also considerable
confusion about green jobs.
Image by Getty Images via @daylife
There should not be. While pinpointing the actual number of jobs
created or destroyed by any particular policy will always be fraught,
the underlying microeconomics are rather simple, and understanding those
microeconomics can make it clear if a given policy will be a net
creator or destroyer of jobs.
While there are many considerations that should be taken into account
when forming policy, such as encouraging new technology which may allow
future growth, and improving the health and well-being of citizens, I
am going to restrict myself to the goal of promoting job creation and
economic activity in this article in order to keep the discussion
relatively simple.
Re-framing the Question
In order to avoid the rather pointless debate about the definition of
a “green job” I will re-frame the question to one that I believe both
sides would agree is more important (at least if they were able to put
aside partisan bickering):
Does a particular green policy create more jobs than it destroys?
If a policy is both green (which I define as lowering our use of
resources and/or environmental impact) and is a net creator of jobs, all
parties should agree that it is a good policy. Green policies which
destroy jobs, on the other hand will require further analysis as to
whether the environmental and health benefits outweigh the economic
losses, a question which requires putting relative value on various
benefits, and cannot be resolved purely by economic reasoning.
Which Policies are Net Job Creators?
I’m aware of two mechanisms by which a policy can increase or decrease economic activity and hence number of jobs.
- Jobs can be created or destroyed by substituting labor for capital, energy, and/or other resources in production.
- If a policy increases economic efficiency, it will increase
economic activity and create jobs. If it decreases economic efficiency,
it will reduce economic activity and destroy jobs.
Substituting Labor for Energy or Capital
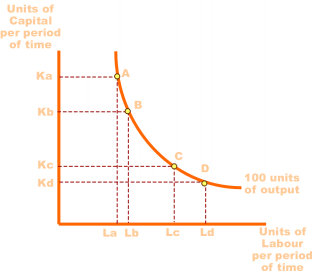
Image Source: Wikipedia
A basic tenet of microeconomics says that there is a tradeoff between
capital, labor and natural resources such as energy in the
production function.
In particular, you can substitute capital for labor (by mechanization)
or labor for capital (by using shovels and picks instead of bulldozers.)
Now add energy into the mix, and you can substitute fossil energy for
either capital or labor to attain the same production.
For example, a hybrid vehicle substitutes capital and resources (in
the form of an electric motor and batteries) for energy (less fuel
consumed to do the same work.) A bus substitutes labor (the bus driver)
for capital, resources and energy (lots of cars and fuel consumed.) A
green building substitutes labor (better architecture/construction) and
some resources (extra insulation) for energy.
From this perspective, any policy that promotes the substitution of
labor for energy will create green jobs, since you get more work and
less energy consumed. Shifting people out of their cars and onto mass
transit will create jobs because there will have to be drivers and
people managing the transit system, where before no one was paid to
drive. To the extent that the transit system can be paid for out of the
reduced fuel costs and car ownership costs of the former drivers turned
riders, the number of jobs created will be a pure economic gain.
Multiplier Effects
That brings us to the other major potential source of jobs from green policies: economic multiplier effects.
To the extent that green policies improve economic efficiency by
overcoming economic barriers to cost effective green solutions, these
policies will result in greater economic activity, and hence more jobs.
The strongest critique of “green jobs” initiatives is that they simply
shift economic activity from out-of-favor “brown” sectors to more
politically correct green ones. Yet when a policy improves economic
efficiency, it does not just shift jobs and capital around in the
economy: it creates economic activity and jobs.
Not all green policies improve economic efficiency. For example,
subsidies for not-yet-economic types of renewable energy such as wave
power and solar installations may be justifiable on the grounds that
they are helping to promote needed future technologies, but they
probably come at a net cost to near-term jobs (even if they may create
more jobs in the long term by allowing the creation of new types of
businesses.)
On the other hand, policies to promote energy efficiency will be
strong net creators of jobs, because the cost of energy efficiency is
typically only a fraction of the cost of the energy saved. The very
existence of opportunities to save significantly on energy bills at
modest cost is proof that the energy market is inefficient. In an
efficient market, all such opportunities would have already been taken.
After the energy efficiency measure has been installed, the cost
savings can be used for useful economic activity, rather than wasted on
unneeded fuel. This money will then spur additional activity and
stimulate jobs.
Using Fossil Resources to Stimulate Growth is Like Stimulating Growth With Debt
Short term jobs (green or otherwise) should not be the only
consideration when forming policy. A short term focus on jobs today can
end up doing long term economic harm. For instance, if we spend too much
borrowed money to create jobs today, the long term drag on the economy
caused by paying back the debt will leave everyone worse off.
Economic growth fueled by the extraction of non-renewable resources
is very similar to economic growth fueled by debt. When we extract these
resources and use them, we increase economic activity today, but their
non-renewable nature means that we lose the opportunity to extract and
use them tomorrow. Hence, the economic stimulus today comes at the cost
of an economic drag tomorrow, and the future economic drag will
generally be larger than today’s stimulus, since improving technology
should allow us to get more benefit from each unit of resource in the
future.
Using renewable resources to stimulate growth does not have this
problem: Tapping the wind or the sun for energy today does nothing to
diminish the wind or sun tomorrow. Hence, to the extent a green job
relies on renewable resources and a brown job relies on fossil
resources, the green job should be preferred, even before taking the
environmental benefits into account.
Policy Implications
If we only consider job creation, the focus on policy should be on
creating jobs and economic activity, with a preference for green jobs,
since those impose less of a cost on future economic activity than jobs
based on extractive industries.
Green jobs can be created either by substituting labor for energy
and capital, or by reducing energy waste so that the money previously
wasted on energy can be put to more productive uses. For policy makers
who wish to create green jobs, the implications are clear.
Green job programs should focus on two types of opportunities:
- Industries where labor can usefully be substituted for energy or capital, such as mass transit.
- Breaking down the barriers to energy efficiency which can stimulate economic activity by allowing money that would otherwise have been wasted.
The converse is also true: if the goal is to create jobs and
stimulate economic activity, subsidies and other policies which
encourage the substitution of capital and energy for labor should be
ended, especially those subsidies which encourage the extraction of
non-renewable resources which only create jobs today at the cost of
future jobs.
The most cost effective policies for creating jobs will be those that
break down the barriers to the adoption of cost-effective green
technologies, especially energy efficiency. Ironically,
most energy subsidies have gone into capital intensive sectors such as nuclear and extractive sectors such as oil and gas.
A very cost effective way to produce jobs would then simply be to
remove subsidies from fossil fuels and nuclear energy and redirect them
towards the most cost effective clean technologies.
Increased support for and promotion of public transit could do much
more to reduce our dependence on imported oil than support for domestic
drilling (which will only make us more dependent on imported oil in the
future by using up domestic resources sooner) while also creating jobs.
Meanwhile, energy efficiency programs such as cash for caulkers can
cost-effectively reduce energy bills and free up money for other sorts
of consumption while also creating jobs in the depressed housing sector.
(originally published in Forbes)