Sunday, November 17, 2013

Boeing 77X


The Boeing Airbus rivalry is as close to a modern day large duopoly as you are likely to get.

$$$$$$$$$$$$$$$$$$$$$$$$$$$$$$$$$$$$$$$$$$$$$$$$$$$$$$$$$$$$$$$$$$$$$$$$$$$$$$$$$$$

By: Michel Merluzeau, Managing Partner, G2 Solutions
CNBC.com | Sunday, 17 Nov 2013 | 4:53 AM ET
The accelerating global commercial aerospace market can find no better spokesperson than Dubai, Qatar and Abu Dhabi. Over the past twenty years, a visionary public policy has transformed the United Arab Emirates (UAE) into a distantly comparable twenty-first century Florence when it comes to investment in opportunities and talent.
This year will perhaps witness the apotheosis of the dominant role played by the gulf airlines with the much anticipated launch of the Boeing 777X aircraft. While there is little doubt that both versions of the aircraft will be launched at the show, some uncertainty remains as to the identity of the launch customers. While Lufthansa has announced its intention to move forward with the acquisition of 777-9s, it's all eyes on four airlines at the show: Emirates, Etihad, Qatar and perhaps also Turkish.

(Read more: Boeing in advanced talks to build 777X in Seattle area: Source)
Emirates President Tim Clark has made it very clear that if Boeing builds the aircraft he needs he would buy significant numbers. The question is, will Emirates actually buy, and what happens if they don't?

There is no doubt that 777X looks like a winner on paper: it builds on lessons learned from the 787 program and offers superb economic performance, generally estimated at 20 percent savings over the current 777 family.

The decision Boeing faces is not so directly connected to the aircraft itself as to whom you build it for? In short, hedge your bets. How the aircraft shapes up will tell us a lot about where Boeing believes growth will come from and who it believes will drive its production over the next twenty years.

(Read more: 'No comment' from Emirates on $30 billion Boeing deal)
If Emirates, Qatar, and Etihad all jump on the bandwagon, then the launch, albeit a little later than expected, should be a resounding success for Boeing and cap a year of challenges and successes for the enterprise. If Emirates does not order in substantial numbers it will be a disappointment, and clearly a sign that Boeing was unable to convince a critically important long-haul airline to sign on the dotted line.

What of the market potential for 777X? Our forecast suggests around 1,000 units as a realistic target. However, will air traffic growth and capacity constraints drive the market towards the A380, or will the 777X size and scalability win the day? A bit of both. After all, this is not a monolithic market in terms of infrastructure, routes and demographics, but we believe that the A380 will do much better than the doomsayers suggest and that the 777X strength will reside in its operational flexibility.
Airbus will be watching and argue, correctly, that its A350 is on target and that there are too many questions as to whether the 777X will be ready by 2020. Thus, Toulouse might have a strong argument that an A350 will come a few years ahead and make an impact in time for airline 777 replacement schedules. Hard to disagree with them on this one.
© 2013 CNBC.com

Sunday, November 10, 2013

Are Consumers all tapped out?


 American shoppers have a way of rallying when the holidays roll around. But years after the Great Recession, consumers' budgets remain badly squeezed by flat wages, higher payroll taxes and a weak job market.
"It's been a tough year for consumers overall," said Target Chief Financial Officer John Mulligan. "They started the year with the payroll tax increase, and lower and middle-income consumers bore the brunt of that. They were already stressed. The economy has improved slowly over time, but it's been a choppy recovery for sure."
Choppy indeed. With the economy growing at just 2.2 percent since the recession ended in June 2009, there aren't enough good-paying jobs for the millions of Americans out of work or looking for more hours.
Much of the growth in new jobs is in relatively low-wage, low-skilled industries such as retailing and restaurants. Even with the growth in those sectors, there aren't enough jobs to go around—and won't be until overall growth picks up.
"The improvement in the employment and improvement in labor markets has been slower than I'd like to see," said Boston Fed President Eric Rosengren. "We need to see growth much closer to 3 percent than 2 percent if we want to get to full employment in a reasonable time period."
(Read more: US consumer sentiment unexpectedly falls in November)
Though the latest read on GDP showed the economy expanding by 2.8 percent in the third quarter, that isn't likely to cheer up Fed officials much. Too much of the growth came from a build-up in inventories—goods sitting in warehouses and on store shelves that consumers aren't buying.
Final sales rose just 2.0 percent, and overall spending inched up just 1.5 percent, the smallest gain in two years, according to Band of America Merrill Lynch economists Ethan Harris and Joshua Dennerlein.
"In other words, the economy remains stuck in the mud," they wrote in a research note Thursday.
(Read more: Consumers trim spending as DC mess drags on)

American households apparently caught a break in September,based on the latest reports on jobs and income. The government reported that 204,000 new jobs were created in September—and personal income rose by 0.5 percent, after similar gains in August.
But the extra income didn't free up consumers wallets.The data also showed that—adjusted for inflation—consumer spending inched up just 0.1 percent in September after rising 0.2 percent in August.
While housing prices have slowly recovered in many parts of the country, mortgage applications remain sluggish, especially for younger first-time home buyers. That weakness spills over into sales of a number of related categories of goods and services—from new appliances to homeowners insurance.

Other industries feeling profit pressure are tightening payrolls. That includes the health-care sector, which produced a steady stream of new jobs even through the depths of the Great Recession.
The widespread efforts to control health-care spending are beginning to show up in the jobs data, according to employment consultant John Challenger.
"The one thing that both parties agree on is that we have to cut costs out of the health-care system," he said. "That usually means when companies do that, there are going to be job cuts. Inevitably were going to be seeing job cuts coming out of that sector for months or maybe years to come."
Consumer spending will remain sluggish as long as job and wage growth does. In the meantime, lower gasoline prices may help, say some analysts.

"It's pretty tough out there," said Jan Kniffen, a retail industry analyst at Worldwide Enterprises. Paying less for gas "puts a lot of money back into discretionary income."
Despite the widespread obsession with oversized numerals posted on top of the pump, those prices make up a relatively small portion of the average household budget: about $3,100 a year for a median
household, with income of roughly $50,000.


Since this year's peak in February, gasoline prices have fallen by about 15 percent, saving that family about $465. That may be enough for a nice TV for Christmas, but it's less than 1 percent of their total household income.

Not everyone is stretched. Luxury retailers are expecting another relatively good holiday shopping season. Brisk sales of high heels and handbags boosted profits for high-end designer Michael Kors by 45 percent in the past year, the company reported Tuesday.

It remains to be seen whether the shutdown—and a pair of looming deadlines for a repeat budget battle—gives consumers pause. Some economists believe people's loss of faith in Washington may cripple confidence and prompt shoppers to hunker down for the holidays.

But others argue that the impact of this summer's political spectacle was transitory.
"We're a happy nation, even with Washington doing everything it can to depress us," said Barry Sternlicht, chairman and CEO of Starwood Capital Group. "We have a very short memory. We like the fact our football teams are on the field and Congress hasn't screwed that up. So we're shopping."
UPDATED: This story was updated with Friday's jobs report numbers.
By CNBC's John Schoen. Follow him on Twitter @johnwschoen.

Saturday, November 2, 2013

More Fat Cats?

Workers’ share of national income

Labour pains

All around the world, labour is losing out to capital

ON AN enormous campus in Shenzhen, in the middle of China’s manufacturing heartland, nearly a quarter of a million workers assemble electronic devices destined for Western markets. The installation is just one of many run by Foxconn, which churns out products for Apple among other brands, and employs almost 1.5m people across China. In America Foxconn has become a symbol of the economic threat posed by cheap foreign labour. Yet workers in China and America alike, it turns out, face a shared threat: they have captured ever less of the gains from economic growth in recent decades.
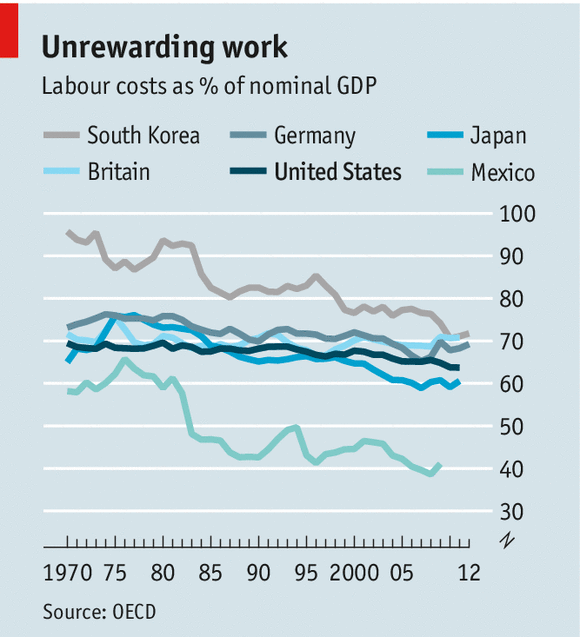
The “labour share” of national income has been falling across much of the world since the 1980s (see chart). The Organisation for Economic Co-operation and Development (OECD), a club of mostly rich countries, reckons that labour captured just 62% of all income in the 2000s, down from over 66% in the early 1990s. That sort of decline is not supposed to happen. For decades economists treated the shares of income flowing to labour and capital as fixed (apart from short-run wiggles due to business cycles). When Nicholas Kaldor set out six “stylised facts” about economic growth in 1957, the roughly constant share of income flowing to labour made the list. Many in the profession now wonder whether it still belongs there.
A falling labour share implies that productivity gains no longer translate into broad rises in pay. Instead, an ever larger share of the benefits of growth accrues to owners of capital. Even among wage-earners the rich have done vastly better than the rest: the share of income earned by the top 1% of workers has increased since the 1990s even as the overall labour share has fallen. In America the decline from the early 1990s to the mid-2000s is roughly twice as large, at about 4.5 percentage points, if the top 1% are excluded.
Workers in America tend to blame cheap labour in poorer places for this trend. They are broadly right to do so, according to new research by Michael Elsby of the University of Edinburgh, Bart Hobijn of the Federal Reserve Bank of San Francisco and Aysegul Sahin of the Federal Reserve Bank of New York. They calculated how much different industries in America are exposed to competition from imports, and compared the results with the decline in the labour share in each industry. A greater reliance on imports, they found, is associated with a bigger decline in labour’s take. Of the 3.9 percentage-point fall in the labour share in America over the past 25 years, 3.3 percentage points can be pinned on the likes of Foxconn.
Yet trade cannot account for all labour’s woes in America or elsewhere. Workers in many developing countries, from China to Mexico, have also struggled to seize the benefits of growth over the past two decades. The likeliest culprit is technology, which, the OECD estimates, accounts for roughly 80% of the drop in the labour share among its members. Foxconn, for example, is looking for something different in its new employees: circuitry. The firm says it will add 1m robots to its factories next year.
Cheaper and more powerful equipment, in robotics and computing, has allowed firms to automate an ever larger array of tasks. New research by Loukas Karabarbounis and Brent Neiman of the University of Chicago illustrates the point. They reckon that the cost of investment goods, relative to consumption goods, has dropped 25% over the past 35 years. That made it attractive for firms to swap labour for software whenever possible, which has contributed to a decline in the labour share of five percentage points. In places and industries where the cost of investment goods fell by more, the drop in the labour share was correspondingly larger.
Other work reinforces their conclusion. Despite their emphasis on trade, Messrs Elsby and Hobijn and Ms Sahin note that American labour productivity grew faster than worker compensation in the 1980s and 1990s, before the period of the most rapid growth in imports. Studies looking at the increasing inequality among workers tell a similar story. In recent decades jobs requiring middling skills have declined sharply as a share of total employment, while employment in high- and low-skill occupations has increased. Work by David Autor of MIT, David Dorn of the Centre for Monetary and Financial Studies and Gordon Hanson of the University of California, San Diego, shows that computerisation and automation laid waste mid-level jobs in the 1990s. Trade, by contrast, only became an important cause of the growing disparity in wages in the 2000s.
Trade and technology’s toll on wages has in some cases been abetted by changes in employment laws. In the late 1970s European workers enjoyed high labour shares thanks to stiff labour-market regulation. The labour share topped 75% in Spain and 80% in France. When labour- and product-market liberalisation swept Europe in the early 1980s—motivated in part by stubbornly high unemployment—labour shares tumbled. Privatisation has further weakened labour’s hold.
Such trends may tempt governments to adopt new protections for workers as a means to support the labour share. Yet regulation might instead lead to more unemployment, or to an even faster shift to automation. Trade’s impact could become more benign in future as emerging-market wages rise, but that too could simply hasten automation, as at Foxconn.
Accelerating technological change and rising productivity create the potential for rapid improvements in living standards. Yet if the resulting income gains prove elusive to wage and salary workers, that promise may not be realised.

Monday, October 28, 2013

Bottled H2O Vs. Soda

Few things are more American than Coca-Cola.

But bottled water is washing away the palate trained to drain a bubbly soda. By the end of this decade, if not sooner, sales of bottled water are expected to surpass those of carbonated soft drinks, according to Michael C. Bellas, chief executive of the Beverage Marketing Corporation.

“I’ve never seen anything like it,” said Mr. Bellas, who has watched water’s rise in the industry since the 1980s.

Sales of water in standard lightweight plastic bottles grew at a rate of more than 20 percent every quarter from 1993 to 2005, he said. The growth has continued since, but now it has settled into percentages within the high single digits.

If the estimated drinking of water from the household tap is included, water consumption began exceeding that of soda in the mid-2000s.

That significant shift has posed a tough challenge for the Coca-Cola Company and rival PepsiCo in recent years. While both companies sell bottled water lines, Dasani for Coke and Aquafina for Pepsi, they have had trouble establishing dominance in the more profitable business of so-called enhanced waters — including flavored and carbonated waters and those with added vitamins and minerals — where a horde of new beverage companies like TalkingRain, Hint water and Fruit2O are giving them a run for the money.

“Given where pricing has gone, I would assume that on the average 24 pack of bottled water, Coke and Pepsi are selling at break-even at best,” said John Faucher, who tracks the beverage and household products businesses at JPMorgan Chase. “The one thing keeping them in plain, old bottled water is that both have a very large and highly profitable single-serve business in it.”
Plain bottled waters are little more than purified tap water with a sprinkle of minerals tossed in, which makes the business one of producing bottles and filling them.

Factors as varied as innovations in bottling technology that have helped drive down the price of water as well as continuing concern about obesity and related diseases are also driving the trend. A recent study by North Dakota State University, for instance, used dietary intake data collected by the federal government to draw correlations between decreased consumption of soda from 1999 through 2010 and improvements in the biomarkers that indicated cholesterol and other chronic diseases.

A study by Coca-Cola asserted that the government’s data, the National Health and Nutrition Examination Survey, was flawed, but that had not stopped public health officials from encouraging greater consumption of beverages with less sugar.

Last month, Michelle Obama heavily endorsed water, teaming up with Coke, Pepsi and Nestlé Waters, among others, to persuade Americans to drink more of it. Health advocates complained that Mrs. Obama had capitulated to corporate partners by not explaining the benefits of water over the sodas they sell and that her initiative promoted even greater use of plastic bottles when she could have just recommended turning on the tap.

Bottled water has also grown cheaper, adding to its attraction. Cases of 24 half-liter bottles of store-brand water can be had for $2, or about 8 cents a bottle, and some grocery store chains even are using waters as loss leaders to attract customers, teeing up shopping carts with a case already on board.

Companies like Niagara Water, a privately held company that is the largest private-label water bottler in the country, have a fully integrated, highly automated production system that starts with plastic pellets that are made into bottles and goes all the way through to filling the bottles, making caps and screwing them on.

This poses a problem for the big beverage companies selling branded waters. “Coke and Pepsi can compete in convenience stores where water is being sold one bottle at a time, but they can’t make money on selling cases at $1.99 apiece,” said John Sicher, publisher of Beverage Digest.
In a conference call with analysts last week, PepsiCo’s chief financial officer, Hugh F. Johnston, said that the company had no plans to invest in increasing its bottled water offerings. “We don’t think it creates value over time,” Mr. Johnston said.

Some of the things that have made Pepsi and Coke formidable competitors in the soda business work against them in water. The companies, for instance, stock grocery store shelves directly off their trucks. That gives them more extensive and timely information about how their products are doing and greater control over marketing, but it also is much more expensive than the distribution system used by companies like Niagara and Nestlé Waters, which has a private label business in addition to marketing brands like Poland Spring and Ozarka.

Those companies let retailers handle stocking, shipping pallets of their waters to warehouses.
Coke sold 5.8 billion liters of waters abroad and 253 million liters in the United States and Canada from 2007 to 2012. Pepsi’s water sales in North America actually declined by 636 million liters over that period, but it still sold 4.7 billion liters overseas, according to Euromonitor.
Both companies’ soda sales fell in North America over that time but grew internationally. Volume sales of soda, however, may be deceptive. “The volume growth is there, but when we’re talking about international markets like China, India and Latin America — prices are lower,” said Jonas Feliciano, an industry analyst at Euromonitor.

The TalkingRain Beverage Company, a bottled water business that started in the Pacific Northwest, is getting out of the plain water business altogether because the economics are so bad. “The water business has become very commoditized,” said Kevin Klock, its chief executive. “Folks in that business have to produce high quantities at fast speed in very light bottles, and it requires a huge investment to be in that game.”

TalkingRain makes Sparkling ICE, a bubbly water that comes in flavors like kiwi strawberry and blackberry with no calories and “vitamins and antioxidants.” The brand had developed strong consumer loyalty in the company’s back yard, consistently generating about $10 million in sales a year when Mr. Klock decided to bet big on it after taking the helm in 2010.

Last year, TalkingRain sold $200 million worth of Sparkling ICE, and sales this year are on track to exceed $400 million, Mr. Klock said. “There’s a large market out there that wants something sparkling, something flavored, something without a controversial sweetener, and we hit that market,” he said.
Now Pepsi and Coke are scrambling to dip their toes into it, too. They are fighting back with investments in flavored and enhanced waters and, in Coke’s case, packaging. Dasani, Coke’s primary water business, comes in the company’s PlantBottle, at least 30 percent of which is made from plant materials.

“First, consumers who purchase Dasani are looking for a high quality product that delivers a high quality taste time and time again,” said Geoff Henry, brand director of Dasani. “Beyond what the brand stands for, we are looking to lead in packaging and sustainability because those things also matter to our consumers.”

On Thursday, Coke introduced its first sparkling Dasani drinks in four flavors, and Pepsi is expected to take the wraps off a premium bottled water product called OM this year, according to Beverage Digest.
Coca-Cola has also been successful with Smartwater, which was part of its $4.1 billion purchase of Glaceau, the maker of Vitaminwater. Smartwater is little more than distilled water with added electrolytes, but volume sales were up by 16.2 percent in the first half of this year, according to Beverage Digest.

Dasani also has introduced Dasani Drops, with flavors like cherry pomegranate and pink lemonade, which consumers add to the drink to fit their taste, a quality especially prized by millennials.
A bumper crop of flavor drops has been coming onto the market ever since Kraft introduced Mio in 2011. SweetLeaf and Stur, for instance, are Stevia-based sweeteners for water that impart flavor. Pepsi recently began selling Aquafina FlavorSplash drops.

Sales of most branded enhanced water, however, were down in the first half of 2013, and whether giving consumers the option to flavor plain water will change that equation remains to be seen. Vitaminwater’s volume sales slid 17.3 percent, for instance, while SoBe Lifewater, a line of flavored waters owned by PepsiCo, dropped 30.3 percent, according to Beverage Digest.
On the other hand, Nestlé and bottlers like Niagara, which carry lower prices, saw sharp increases in volume sales of their enhanced waters.

“Is it a great idea? Not necessarily,” Mr. Faucher said of the big companies’ push into enhanced waters. “Do they have much of a choice? Not necessarily. People want variety and so Coke and Pepsi are going where the opportunity is. There aren’t a lot of other options.”


Sunday, October 13, 2013

Color of Affordable Care


Nancy Folbre is professor emerita of economics at the University of Massachusetts, Amherst.

Shortly after House Republicans shut down the federal government in an effort to halt implementation of the Affordable Care Act, Sabrina Tavernise and Robert Gebeloff of The New York Times reported that many Republican-controlled states have already strangled an important feature of the legislation by denying extension of Medicaid eligibility to the working poor.
Since the federal government committed to shouldering most of the cost of such extensions, the officials running these states seem to be cutting off their own noses to spite their faces. Then again, perhaps the noses they are cutting off are not their own.
Neither Republican officials nor their most valuable constituencies need help paying for health insurance. When they say they oppose government spending what they really mean is that they oppose spending on programs like Medicaid that – unlike universal programs such as Social Security – target low-income families.
The disparate racial impact is striking: 68 percent of poor and uninsured blacks live in states that are not extending eligibility, compared with 58 percent of poor and uninsured persons in other racial categories.

The concentration of negative effects in Southern states that also represent the stronghold of Congressional opposition to the law itself is not surprising. This episode of political history fits neatly into an established line of research that shows how federal efforts to extend protections to the disadvantaged have repeatedly fallen prey to a toxic blend of racial and regional politics. From civil rights to health insurance, white political leaders from states with large numbers of African-Americans — especially but not exclusively in the South — have cast new federal protections in apocalyptic terms and mounted a powerful opposition.
In her pioneering book “The Color of Welfare,” published in 1994, the sociologist Jill Quadagno persuasively documented the race-based politics that sent the United States down a policy path very different from that of other affluent countries, blocking the federal extension of most universal social programs other than Social Security and Medicare and giving states significant control over means-tested programs targeted at the poor. This control allowed politicians in Southern states to restrict benefits for low-income families, whatever their color.
A host of academic studies have explored the impact of intersections between race and class, noting, for instance, that in states with larger black populations race becomes more salient to the politics of social provision, altering the dynamics of social and political trust. Poor whites are promised protection against labor market competition or higher taxes in return for acquiescence with policies that restrict the social safety net.
As the Stanford economist Gavin Wright shows in his new history of the Civil Rights Movement, “Sharing the Prize,” Southern whites often overestimated the costs – and underestimated the benefits – that integration would bring them.
In “Disciplining the Poor,” an analysis of welfare reforms introduced in the mid-1990s, Joe Soss, Richard C. Fording and Sanford F. Schram demonstrate that states with a large number of African-Americans (especially but not exclusively in the South) imposed particularly stringent rules on access to public cash assistance, as well as keeping benefit levels extremely low.
In “Taxing the Poor,” Katherine Newman and Rourke O’Brien show that state income and sales taxes in the South are far more regressive than those in other regions of the country, penalizing all low-income families.
Overt racism and outright discrimination now elicit strong social disapproval, but racial bias takes a more subtle, coded form. In “Why Americans Hate Welfare,” Martin Gilens documents a tendency for Americans to systematically overestimate the percentage of public welfare spending going to blacks. His content analysis of pictures accompanying stories about poverty in three major newsmagazines between 1967 and 1992 showed that the frequency with which African-Americans were depicted far exceeded their actual representation in the population.
An Associated Press survey of racial attitudes conducted immediately before the presidential election last year clearly suggests that most Americans try not to discriminate, but that racial loyalties shape their perceptions of economic benefits.
When asked if President Obama’s race affected the likelihood they would vote for him, 80 percent of respondents said no. Yet 28 percent of respondents believed that his policies had made black Americans better off, compared with only 15 percent who believed they had made white Americans better off.
I don’t know of any analysis of the president’s economic stimulus program – or any other policy – purporting to show that blacks benefited more than whites. Indeed, the comparison itself is oddly optimistic, because neither black nor white Americans outside the top 1 percent of the population have enjoyed significant increases in family income since 2009.
Respondents predisposed to believe that a black president will try to benefit blacks more than whites are likely to view the Affordable Care Act through a racial lens, which helps explain the results of a recent Pew survey showing that almost 91 percent of blacks currently approve of the law, compared with 29 percent of whites.
This approval gap overshadows the effect of factors directly relevant to eligibility for assistance. Among those with annual family incomes of less than $50,000, 50 percent currently approve of the law, compared with 38 percent of those with higher incomes (who are less likely to benefit from it).
It’s important to note that many people who don’t approve (about 17 percent, according to a recent Kaiser Foundation poll) feel the Affordable Care Act doesn’t go far enough in reforming the way we pay for health care. Further, the complexity of the legislation makes it difficult for individuals to predict its economic consequences (the Pew survey reported that only 25 percent of poll respondents said they had a very good understanding of how the law would affect them).
Controversy and confusion make it easier for politicians to prey on pre-existing prejudices that serve their own interests better than those of their least influential constituents, as became apparent in the first stage of the civil rights movement.
This movement has yet to reach its final stage. Access to affordable health insurance should be considered a civil right for everyone.

Sunday, October 6, 2013

What Unemployment Would Have Been Like.

  •  
  • One of the reports that the Federal government was not able to issue last Friday, as a result of the partial government shutdown, was the unemployment report for September 2013. The following essay is a speculation on what the report would have been like.

156,000: The numbers of jobs added in September, according to an amalgamation of several private sources of labor market data.
Like the National Zoo’s panda cams, the Bureau of Labor Statistics‘ jobs report was a victim of the government shutdown.
Absent the BLS report, other data, mostly from private sources, offer hints about last month’s job markets. The cumulative result: probably no surprise pop in payrolls or unexpected worsening in unemployment.
Three sources give estimates on private hiring using different ways to arrive at their numbers.
Automatic Data Processing reported a gain of 166,000. Job search engine Bright.com said 164,000 jobs were added. While the Liscio report still has not made an official estimate, its survey “is consistent with another 150,000 increase in private employment.”
Trimtabs Investment Research said the total U.S. economy added 159,000. Using all four estimates and adjusting for government layoffs that have averaged 5,000 a month so far in 2013, total payrolls look to have grown by just 156,000 in September, far less than the 181,000 projected by economists.
Perceptions of the labor markets, however, offer a more positive spin for September, with one big exception.
Consumers clearly perceive job prospects were better in September than in August, a trend that suggests the jobless rate held at 7.3% or fell slightly.
The Conference Board reported more people last month thought jobs were “plentiful” and fewer thought jobs were “hard to get.” In the latest consumer poll done by the Royal Bank of Canada, the employment index rose to the highest level since October 2007 and the share of consumers who worry about losing a job fell to the lowest since the survey started in 2010.
Among businesses, though, sentiment is more mixed.
On the plus side, the drop in jobless claims means businesses are laying off fewer workers. On-line help-wanted advertising jumped in September, the Conference Board says. And the Institute for Supply Management‘s employment index for manufacturing showed an increase in factory hiring.
However, another ISM datapoint is the big exception to the demand for labor. The job index for non-manufacturers–mainly service providers but also the construction and public administration sectors–was unexpectedly weak in September. That is worrisome since non-manufacturers employ the lion’s share of U.S. workers.
It is unclear when the September payrolls report will be released. And if politicians don’t come to a budget agreement soon, the October payrolls survey could run into trouble.
What is important to keep in mind is that–for all the hoopla and market attention paid to it–the first print of the payrolls number is not the final word. The BLS revises data two months back. Then it conducts annual and benchmark revisions that can completely change what we thought we knew about the labor market.
For instance, when the BLS first reported only 88,000 jobs were created in March, it triggered fears of a spring slump. The twice-revised number now shows a more respectable 142,000 jobs added.

Sunday, September 29, 2013

Monopoly Power !!!

Did US beer mergers cause a price increase? 


Orley Ashenfelter, Daniel Hosken, Matthew Weinberg, 18 September 2013


Football season is here. Bud, Miller, or Coors, the classic American lagers, are the beverage of choice to accompany the big game throughout the US. Despite the recent surge of microbrews and imports, the big three brands still capture more than 60% of the market. With the recent merger of Miller and Coors only two large national brewers remain. No doubt many beer drinkers have wondered whether this merger has raised the price of their brand.
We have recently taken up the task of answering this question. We did this for two related reasons.
  • We wanted to measure net price increases to beer drinkers.
  • But we also wanted to see if we could sort out (a) the cost savings that might result from beer production being closer to consumers from (b) the monopolistic pressure on prices that mergers encourage.
As it turns out, breweries make a great place to study these two issues because shipping beer to markets far away is costly.
What did we find? Well, it turns out there were both anti-competitive effects of the merger and cost saving effects. What this means in practice is that whether a beer drinker faced a price increase or a price decrease depended on where the drinker lived. On average prices neither increased nor decreased, with increases in some markets being offset by decreases in others.

Merger effects in principle

In theory, a merger gives the combined firm an incentive to increase price. Some of the sales that would have been lost pre-merger following a price increase are now recaptured because the product portfolio owned by the firm has increased. Simultaneously, the merger can result in reductions in marginal cost that provide the combined firm with an incentive to lower prices.
This cost-versus-margin trade-off has been understood by antitrust economists since at least the publication of Williamson’s (1968) classic paper describing the welfare analysis of mergers. It has been included in the US evaluation of mergers since the publication of the 1982 version of the US Department of Justice’s and Federal Trade Commission’s Horizontal Merger Guidelines. Surprisingly, given their potential importance to policy analysis, there is very little direct evidence that merger specific efficiencies (reductions in marginal cost) can offset the incentive of a merger firm to increase price.

Efficiencies brewed

In June of 2008, the US Department of Justice approved a joint venture between Miller and Coors, then the second and third largest firms in the industry. Although the merger substantially increased concentration in an already concentrated industry, it was allowed because of anticipated reductions in shipping and distribution costs (Heyer et al. 2008). Prior to the merger Coors was brewed in only two locations, while Miller was brewed in six locations more uniformly distributed across the US. The merger was expected to allow the combined firm to economise on shipping costs primarily by moving the production of Coors into Miller plants. These are exactly the kind of cost savings that could offset any incentive to increase prices through a loss of competition.
Two features of the beer industry assist us in estimating the effects of the merger.
  • First, by law beer is sold through a three-tier distribution chain.
With minor exceptions, a brewer must first sell its products to a state-licensed distributor who then sells these products to a retail outlet. These regulations effectively split the US into a number of distinct markets in which brewers can charge different wholesale prices without fear that they will be arbitraged away by transhipment.
  • Second, there were substantial differences in how the merger was expected to increase concentration and reduce costs across markets in our data.
These two features of beer markets create a natural experiment that allowed us to identify how a merger of firms selling national brands changed pricing.

Research design

The basic idea in our paper is to compare price changes across regions that differed in the size of Miller and Coors prior to the merger and how the merger would reduce the distance to the nearest brewery.
  • Figure 1 demonstrates the approach we took in its simplest form.
The figure compares the average price growth before and after the merger of all lager-style beers to changes in predicted increases in concentration and the reduction in distance.
  • The first panel shows that average prices grew faster in regions where the merger was expected to increase concentration by more, as measured by the increase in the Herfindhal Index (sum of squared market shares), holding constant the reduction in distance.
  • On the other hand, price growth tended to be lower in markets where the reduction in distance to the nearest Coors brewery was greater, holding constant the market power effect.
Figure 1.

We also explored the timing of these two effects. Firms can likely leverage any increase in market power very soon after the merger is consummated or even after it is announced and management teams begin anticipating combining operations. In contrast, efficiencies gained through shifting production will not be realised until the merger is actually consummated and then may be realised only with some time.
  • Figure 2 traces out the timing of the effect of the predicted increase in concentration on pricing.
The figure shows that while there is some evidence that the merged firm started increasing prices as soon as the merger was announced, prices increased gradually.
Figure 2.

Figure 3 presents the timing of the effect of the reduced distance on pricing. The figure shows that the reductions in shipping costs were not passed through until about a year and a half after the merger was approved, consistent with industry documents describing the operations of the combined firm.
Figure 3.

We find that the efficiency effect eventually nearly exactly offset the market power effect in the average market. Despite reducing the number of macro brewers in the US from three to two, the Miller/Coors merger did not harm the average consumer.

Conclusion

Over the past 20 years a large number of studies have studied how mergers have changed pricing. In a meta-analysis, Kwoka (2013) shows that most studies have found that prices rise after competitors merge. However, not all papers find price increases. The evidence in the petroleum industry is mixed, and Ashenfelter and Hosken (2010) found that four out of five large mergers of retail consumer-product manufacturers raised prices. Presumably, cost savings are the reason why some of the studied mergers of competitors did not result in higher prices. Our current work suggests this is the case and takes a step towards getting inside the black box of how mergers change pricing incentives.

References

Ashenfelter, Orley and Daniel Hosken, “The Effects of Mergers on Prices: Evidence from Mergers on the Enforcement Margin,” Journal of Law and Economics, 2010, 53 (3), 417-66.
Heyer, Ken, Carl Shapiro and Jeffrey Wilder, “The Year in Review: Economics at the Antitrust Division, 2008-2009,” Review of Industrial Organization, 2008, 35, 349-67.
Kwoka, Jon E., “Does Merger Control Work? A Retrospective on US Enforcement Actions and Merger Outcomes,” Antitrust Law Journal, 2013, 38 (3)
Williamson, Oliver, “Economies as an Antitrust Defense: The Welfare Tradeoffs,” The American Economic Review, March 1968, 58 (1), 18-36

Sunday, September 22, 2013

In Praise of Art Forgery

Fakes say some interesting things about the economics of art

WHAT makes an artist great? Brilliant composition, no doubt. Superb draughtsmanship, certainly. Originality of subject or of concept, sometimes. But surely true greatness means that the creator of a painting has brought a certain je ne sais quoi to the work as well.
There is, however, a type of person who seems to sait perfectly well what that quoi is, and can turn it out on demand. In 1945, for example, a Dutchman named Han van Meegeren faced execution for selling a national art treasure, in the form of a painting by Vermeer, to Hermann Göring, Hitler’s deputy. His defence was that it was a forgery he had painted himself. When asked to prove it by copying a Vermeer he scorned the offer. Instead he turned out a completely new painting, “Jesus Among the Doctors”, in the style of the master, before the eyes of his incredulous inquisitors.
Göring, who was facing a little local difficulty at the time, did not sue van Meegeren. But that has not been the experience of Glafira Rosales, an art dealer in New York who admitted this week that she has, over the past 15 years, fooled two local commercial art galleries into buying 63 forged works of art for more than $30m. She is being forced to give the money back, and is still awaiting sentence.
A load of Pollocks
Ms Rosales is guilty of passing goods off as something they are not, and should take the rap for the fraud. But although art forgers do a certain amount of economic damage, they also provide public entertainment by exposing the real values that lie at the heart of the art market.
That art market pretends that great artists are inimitable, and that this inimitability justifies the often absurd prices their work commands. Most famous artists are good: that is not in question. But as forgers like van Meegeren and Pei-Shen Qian, the painter who turned out Ms Rosales’s Rothkos and Pollocks, show, they are very imitable indeed. If they were not, the distinction between original and knock-off would always be obvious. As Ms Rosales’s customers have found, no doubt to their chagrin, it isn’t.
If the purchasers of great art were buying paintings only for their beauty, they would be content to display fine fakes on their walls. The fury and embarrassment caused by the exposure of a forger suggests this is not so.
Expensive pictures are primarily what economists call positional goods—things that are valuable largely because other people can’t have them. The painting on the wall, or the sculpture in the garden, is intended to say as much about its owner’s bank balance as about his taste. With most kit a higher price reduces demand. But art, sports cars and fine wine invert the laws of economics. When the good that is really being purchased is evidence that the buyer has forked out a bundle, price spikes cause demand to boom.
All this makes the scarcity and authenticity that underpin lofty valuations vital. Artists forget this at their peril: Damien Hirst’s spot pictures, for instance, plummeted in value when it became clear that they had been produced in quantities so vast nobody knew quite how many were out there, and when the market lost faith in a mass-production process whose connection with the original artist was, to say the least, tenuous.
Ms Rosales’s career is thus a searing social commentary on a business which purports to celebrate humanity’s highest culture but in which names are more important than aesthetics and experts cannot tell the difference between an original and a fake. Unusual, authentic, full of meaning—her life itself is surely art, even if the paintings were not. (The Economist)

Sunday, September 15, 2013

After a Financial Flood, Pipes Are Still Broken


 This is a slightly longer article than usual but it is about the fifth anniversary of a major economic collapse.

By

 IT’S been five years since the bankruptcy filing of Lehman Brothers set off the worst economic crisis in the United States since the Great Depression. With the perspective that distance provides, it’s worth asking: Is our financial system safer and sounder today than it was back then?

Many of the nation’s bankers, lawmakers and regulators might well say yes, arguing that safeguards have been put in place to protect against another cataclysm. The voluminous Dodd-Frank law, with its hundreds of rules and new regulatory regimes, was the centerpiece of these efforts.
And yet, for all the new regulations governing derivatives, mortgages and bank holding companies, a crucial vulnerability remains. It’s found in our vast and opaque securities financing system, known as the repurchase obligation or repo market. Now $4.6 trillion in size, it is where almost every financial crisis since the 1980s has begun. Little has been done, however, to reduce its risks.
The repo market, also known as the wholesale funding market, is the plumbing of the financial system. Without it, money could not flow freely, and banks, brokerage firms and asset managers would not be able to conduct their trades and open for business each day.
When institutions sell securities in this market, they do so with the promise that they can be repurchased the next day — hence the “repo market” name. By using this market, banks can finance their securities holdings relatively cheaply, money market funds can invest cash productively and institutions can borrow securities so they can sell them short or deliver them in other types of trades.
Among the biggest participants that provide funding in this market are the money market mutual funds; they lend their cash to banks and other institutions, accepting collateral like mortgage securities in exchange. The money market funds accept a small amount of interest on these overnight loans in exchange for being able to unwind the transactions daily, if need be.
When markets are operating smoothly, most wholesale funding trades are not unwound the next day. Instead, they are rolled over, with both parties agreeing to renew the transaction. But if a participant decides not to renew because of concerns about a trading partner’s potential failure, trouble can arise.
In other words, this is a $4.6 trillion arena operating on trust, which can disappear in an instant.
Both Bear Stearns and Lehman Brothers collapsed after their trading partners in the repo market became nervous and stopped lending them money. For decades, the firms had financed their holdings of illiquid and long-term assets — like mortgage securities and real estate — in the overnight repo markets. Not only was the repo borrowing low-cost, it also allowed them to leverage their operations. Best of all, accounting rules let repo participants set aside little in the way of capital against the trades.
“It was a very unstable form of funding during the crisis and it is still a problem,” said Sheila Bair, former head of the Federal Deposit Insurance Corporation, and chairwoman of the Systemic Risk Council, a nonpartisan group that advocates financial reforms, in an interview. “The repo market is also highly interconnected because the trades are done between financial institutions.”
Some government officials have also voiced concerns recently about risks in the repo market. William C. Dudley, president of the Federal Reserve Bank of New York, referred to the issue in a February speech and Ben S. Bernanke, the Fed chairman, discussed the problems with wholesale funding in a speech in May. The Securities and Exchange Commission published a bulletin in July on the vulnerabilities in the repo market as they relate to money market funds.
Another problem in this market is that only two banks — Bank of New York Mellon and, to a lesser degree, JPMorgan Chase — dominate the business. There used to be a number of clearing banks, as the banks that stand in the middle of the trades are known, but the ranks have dwindled because of industry consolidation.
Unfortunately, these weaknesses remain. “A lot of things have been done to address a lot of specific problems but it doesn’t seem like anything has been done to address the overall problem of institutions losing access to financing,” said Scott Skyrm, a repo market veteran and author of “The Money Noose — Jon Corzine and the Collapse of MF Global.”
Mr. Skyrm said regulators appeared to be tackling the problem through a back door involving capital requirements. For example, new leverage ratios proposed by the international Basel Committee and United States financial regulators would require banks for the first time to set aside capital against the assets they finance in the repo markets. A recent report from J.P. Morgan estimates that under the Basel proposal, the eight largest domestic banks would have to raise $28 billion to $34 billion in capital relating to their repo business.
Banks are likely to consider an alternative: shrinking their repo operations. But the liquidity in this titanic market is essential for the government’s financing of its debt. As the J.P. Morgan report noted, trading volumes in the United States government bond market are closely linked to the amount of repos outstanding. So any contraction in the arena may reduce liquidity in the Treasury market.
SOME experts think that the answer to the repo problem lies in creating a central clearing platform that would allow all participants, not just the banks, to trade directly. Similar platforms have been mandated for derivatives under Dodd-Frank and could be constructed to support the wholesale funding market.
While such an entity would be a too-big-to-fail institution, so are the two banks now serving as intermediaries. And a central clearing platform could be set up as a utility, with officials monitoring transactions and requiring margin payments to finance bailouts in the event of a participant’s default.
Peter Nowicki, the former head of several large bank repo desks, is an advocate of this idea. “Repo is the last over-the-counter market that’s not headed toward central clearing and the Fed should mandate a change,” he said. “Should a large dealer have a problem or the clearing banks have an issue, the repo market could shut down.”
And that, five years after the Lehman collapse, would be an unconscionable failure.


Saturday, September 7, 2013

What Stock to Buy?

What Stock to Buy? Hey, Mom, Don’t Ask Me


OVER the last few weeks, as the stock market has reached new highs, my thoughts have turned to my 85-year-old mother.
“O.K. Mr. Smarty-Pants,” she often asks me, “what stock should I buy now?”
She first asked me this question when I was an undergraduate at Princeton, majoring in economics. She asked again when I was a graduate student at M.I.T., earning a Ph.D. in economics. And she has asked it regularly during the last three decades when I have been an economics professor at Harvard.
Unfortunately, she has never been happy with my answers, which are usually evasive. Nothing in the toolbox of economists makes us good stock pickers.
Yet we economists have written countless studies about the stock market. Here is a summary of what we know:
THE MARKET PROCESSES INFORMATION QUICKLY One prominent theory of the stock market — the efficient markets hypothesis — explains how answering my mother’s question would be a fool’s errand. If I knew anything good about a company, that news would be incorporated into the stock’s price before I had the chance to act on it. Unless you have extraordinary insight or inside information, you should presume that no stock is a better buy than any other.
This theory gained public attention in 1973 with the publication of “A Random Walk Down Wall Street,” by Burton G. Malkiel, the Princeton economist. He suggested that so-called expert money managers weren’t worth their cost and recommended that investors buy low-cost index funds. Most economists I know follow this advice.
PRICE MOVES ARE OFTEN INEXPLICABLE Even if changes in stock prices are unpredictable, as efficient markets theory suggests, we should be able to explain these changes after the fact. That is, we should be able to identify the news that causes stock prices to rise and fall. Sometimes we can, but often we can’t.
In 1981, Robert J. Shiller, a regular contributor to this column and an economics professor at Yale, published a paper in The American Economic Review called, “Do Stock Prices Move Too Much to Be Justified by Subsequent Changes in Dividends?” He argued that stock prices were too volatile. In particular, they fluctuated much more than a rational valuation of the underlying fundamentals would.
Mr. Shiller’s paper prompted a storm of controversy. My reading of the subsequent academic literature is that his conclusions, though not all his techniques, have survived the debate. Stock prices seem to have a life of their own.
Advocates of market rationality now say that stock prices move in response to changing risk premiums, though they can’t explain why risk premiums move as they do. Others suggest that the market moves in response to irrational waves of optimism and pessimism, what John Maynard Keynes called the “animal spirits” of investors. Either approach is really just an admission of economists’ ignorance about what moves the market.
HOLDING STOCKS IS A GOOD BET The large, often inexplicable movements in stock prices might deter someone from holding stocks in the first place. Many Americans, even some with significant financial assets, avoid stocks altogether. But doing so is a mistake, because the risk of holding stocks is amply rewarded.
In 1985, Rajnish Mehra and Edward C. Prescott, both now at Arizona State University, published a paper in the Journal of Monetary Economics called “The Equity Premium: A Puzzle.” They pointed out that over a long time span, stocks have earned, on average, about 6 percent more per year than safe assets like Treasury bills. This large premium, they said, is hard to explain with standard economic models. Sure, stocks are risky, so you can never be certain you’ll earn the premium, but they are not risky enough to justify such a large expected return.
Since the paper was published, economists have made some limited progress in explaining the equity premium. In any event, the large premium has convinced most of us that stocks should be part of everyone’s financial plan. I allocate 60 percent of my financial assets to equities.
Stocks may be an especially good deal today. According to a recent study by two economists at the Federal Reserve Bank of New York, given the low level of interest rates, the equity premium now is the highest it has been in 50 years.
DIVERSIFICATION IS ESSENTIAL Every time a company experiences a catastrophic decline — consider Enron or Lehman Brothers — reports emerge about employees who held most of their wealth in company stock. These stories leave economists slapping their heads. If there is one thing we know for sure, it is that sensible financial management requires diversification.
So, if you have more than 5 percent of your assets in any one company, call your broker and sell. Doing otherwise means exposing yourself to extra risk without extra reward.
SMART INVESTORS THINK GLOBALLY One widely documented failure of diversification is what economists call home bias. People tend to invest disproportionately in their home country.
Most economists take a more global perspective. The United States represents a bit under half of the world’s stock portfolio. Because Europe, Japan and the emerging markets don’t move in lock step with the United States, it makes sense to invest abroad as well.
Which brings me back to my mother’s question: If I could pick just one stock for someone to buy, what would it be? I would now suggest something like the Vanguard Total World Stock exchange-traded fund, which started trading in 2008. In one package, you can get low cost and maximal diversification. It may not be as exciting as trying to pick the next Apple or Google, but you’ll sleep better at night.
N. Gregory Mankiw is a professor of economics at Harvard.

Saturday, March 30, 2013

Too Big to Fail Banks are "Crony" Capitalism.


One phrase that became a household word as a result of the last financial meltdown is "too big to fail". Many have insisted that we need to break up all such banks while others have argued that the real issue is not one of size but one of interdependence i.e. a bank becomes more crucial to the economy when its failure will bring about a systemic failure and not only because it is large. The following article is a summary of the views of the president of the Dallas Federal reserve Bank who is a strong supporter of the view that the US does not have to put up with banks that are too big to fail. Read and comment.

************************************************************************************

The largest U.S. banks are "practitioners of crony capitalism," need to be broken up to ensure they are no longer considered too big to fail, and continue to threaten financial stability, a top Federal Reserve official said on Saturday.

Richard Fisher, president of the Dallas Fed, has been a critic of Wall Street's disproportionate influence since the financial crisis. But he was now taking his message to an unusual audience for a central banker: a high-profile Republican political action committee.
 

Fisher said the existence of banks that are seen as likely to receive government bailouts if they fail gives them an unfair advantage, hurting economic competitiveness.

"These institutions operate under a privileged status that exacts an unfair tax upon the American people," he said on the last day of the annual Conservative Political Action Conference (CPAC).

"They represent not only a threat to financial stability but to fair and open competition … (and) are the practitioners of crony capitalism and not the agents of democratic capitalism that makes our country great," said Fisher, who has also been a vocal opponent of the Fed's unconventional monetary stimulus policies.
Fisher's vision pits him directly against Fed Chairman Ben Bernanke, who recently argued during congressional testimony that regulators had made significant progress in addressing the problem of too big to fail. Bernanke asserted that market expectations that large financial institutions would be rescued is wrong.
But Fisher said mega banks still have a significant funding advantage over its competitors, as well as other advantages. To address this problem, he called for a rolling back of deposit insurance so that it would extend only to deposits of commercial banks, not the investment arms of bank holding companies.

"At the Dallas Fed, we believe that whatever the precise subsidy number is, it exists, it is significant, and it allows the biggest banking organizations, along with their many nonbank subsidiaries - investment firms, securities lenders, finance companies - to grow larger and riskier," he said.

Fisher argued Dodd-Frank financial reforms were overly complex and therefore counterproductive.
"Regulators cannot enforce rules that are not easily understood," he said.

(Reporting by Pedro Nicolaci da Costa; editing by Gunna Dickson)

Sunday, March 17, 2013

Microeconomics of Scarcity

Hose tripe

Banning hosepipe use is a poor solution to a water shortage

How should we respond to scarcity? Should we increase the price or should we issue rationing coupon? An interesting real world article from the Economist.
 
*********************************************************************************

SPRAY the begonias or flout the law? That is the dilemma facing gardeners in England after a hosepipe ban came into force on April 5th. Another dry winter means that water is in short supply: anyone caught using a hose to refresh a parched lawn or clean a dirty car faces a £1,000 ($1,600) fine. And if you happen to own an ornamental fountain, forget it.
The ban's aim is off. It targets how water is transported, not its consumption—which metering would do. The obsessive car cleaner can use hundreds of buckets of water without fear. Nor is the ban likely to be strictly enforced. The last time hoses were widely forbidden, in 2006, two in seven people ignored the rule. Water firms have abandoned plans to set up hose hotlines enabling customers to shop their neighbours. There is no sign yet of hose vigilantes.

The economics of the ban are all wrong, too. With low supply and high demand, prices in an unregulated market would rise. But the hose ban aims to reduce the quantity of water consumed while maintaining a cap on the price. In a forthcoming article, Jeremy Bulow of Stanford Business School and Paul Klemperer of Oxford University use theory to show that such price caps mean those who value a good most do not necessarily get it. And because they can't pay for it, consumers commit effort to finding other ways of obtaining what they want.

Indeed, the kind of behaviour predicted by theory is already visible. Dedicated websites provide lots of ideas for sidestepping the ban by exploiting loopholes in the law. Power-washing the patio is acceptable if motivated by health-and-safety concerns—to blast away potentially slippery moss, for example. Fountains may be allowed to flow, as long as they lead into ponds containing goldfish.

Another paper, by Tim Leunig of CentreForum, a think-tank, argues that heavy water users should be offered flexible contracts which would reward them for reducing usage in times of drought (farmers could plant less water-intensive crops, for example). They would be paid for each litre they forgo. That would leave the water company out of pocket but with more water. It could then sell this surplus to those that want it, at a higher price. An alternative would be to meter all water users, and to vary the price according to availability. That would, of course, mean installing meters in every house—which would be expensive, but probably a good idea anyway.

Sunday, March 10, 2013

Does Daylight Saving cost More Energy?

It is interesting to read the following and learn that there are some seious studies that have concluded that Day Light Savings does in fact cost more energy. Read and comment.


For decades, conventional wisdom has held that daylight-saving time reduces energy use. But a unique situation in Indiana provides evidence challenging that view: Springing forward may actually waste energy.
Ben Franklin may not having been saving much candlewax by springing forward.
Up until two years ago, only 15 of Indiana’s 92 counties set their clocks an hour ahead in the spring and an hour back in the fall. The rest stayed on standard time all year, in part because farmers resisted the prospect of having to work an extra hour in the morning dark. But many residents came to hate falling in and out of sync with businesses and residents in neighboring states and prevailed upon the Indiana Legislature to put the entire state on daylight-saving time beginning in the spring of 2006.

Indiana’s change of heart gave University of California-Santa Barbara economics professor Matthew Kotchen and Ph.D. student Laura Grant a unique way to see how the time shift affects energy use. Using more than seven million monthly meter readings from Duke Energy Corp., covering nearly all the households in southern Indiana for three years, they were able to compare energy consumption before and after counties began observing daylight-saving time. Readings from counties that had already adopted daylight-saving time provided a control group that helped them to adjust for changes in weather from one year to the next.

Their finding: Having the entire state switch to daylight-saving time each year, rather than stay on standard time, costs Indiana households an additional $8.6 million in electricity bills. They conclude that the reduced cost of lighting in afternoons during daylight-saving time is more than offset by the higher air-conditioning costs on hot afternoons and increased heating costs on cool mornings.
“I’ve never had a paper with such a clear and unambiguous finding as this,” says Mr. Kotchen, who presented the paper at a National Bureau of Economic Research conference.

A 2007 study by economists Hendrik Wolff and Ryan Kellogg of the temporary extension of daylight-saving in two Australian territories for the 2000 Summer Olympics also suggested the clock change increases energy use.

That isn’t what Benjamin Franklin would have expected. In 1784, he observed what an “immense sum! that the city of Paris might save every year, by the economy of using sunshine instead of candles.” (Mr. Franklin didn’t propose setting clocks forward, instead he satirically suggested levying a tax on window shutters, ringing church bells at sunrise and, if that didn’t work, firing cannons down the street in order to rouse Parisians out of their beds earlier.)

Sunday, March 3, 2013

Minimum Wage

An excellent must read article about minimum wages. I usually would not post back to back on the same issue but this is an exception. Enjoy the treat.

*********************************************************************************

Economic View

The Business of the Minimum Wage

RAISING the minimum wage, as President Obama proposed in his State of the Union address, tends to be more popular with the general public than with economists.
Mark Allen Miller
I don’t believe that’s because economists care less about the plight of the poor — many economists are perfectly nice people who care deeply about poverty and income inequality. Rather, economic analysis raises questions about whether a higher minimum wage will achieve better outcomes for the economy and reduce poverty.
First, what’s the argument for having a minimum wage at all? Many of my students assume that government protection is the only thing ensuring decent wages for most American workers. But basic economics shows that competition between employers for workers can be very effective at preventing businesses from misbehaving. If every other store in town is paying workers $9 an hour, one offering $8 will find it hard to hire anyone — perhaps not when unemployment is high, but certainly in normal times. Robust competition is a powerful force helping to ensure that workers are paid what they contribute to their employers’ bottom lines.
One argument for a minimum wage is that there sometimes isn’t enough competition among employers. In our nation’s history, there have been company towns where one employer truly dominated the local economy. As a result, that employer could affect the going wage for the entire area. In such a situation, a minimum wage can not only make workers better off but can also lead to more efficient levels of production and employment.
But I suspect that few people, including economists, find this argument compelling today. Company towns are largely a thing of the past in this country; even Wal-Mart Stores, the nation’s largest employer, faces substantial competition for workers in most places. And many employers paying the minimum wage are small businesses that clearly face strong competition for workers.
Instead, most arguments for instituting or raising a minimum wage are based on fairness and redistribution. Even if workers are getting a competitive wage, many of us are deeply disturbed that some hard-working families still have very little. Though a desire to help the poor is largely a moral issue, economics can help us think about how successful a higher minimum wage would be at reducing poverty.
An important issue is who benefits. When the minimum wage rises, is income redistributed primarily to poor families, or do many families higher up the income ladder benefit as well?
It is true, as conservative commentators often point out, that some minimum-wage workers are middle-class teenagers or secondary earners in fairly well-off households. But the available data suggest that roughly half the workers likely to be affected by the $9-an-hour level proposed by the president are in families earning less than $40,000 a year. So while raising the minimum wage from the current $7.25 an hour may not be particularly well targeted as an anti-poverty proposal, it’s not badly targeted, either.
A related issue is whether some low-income workers will lose their jobs when businesses have to pay a higher minimum wage. There’s been a tremendous amount of research on this topic, and the bulk of the empirical analysis finds that the overall adverse employment effects are small.
Some evidence suggests that employment doesn’t fall much because the higher minimum wage lowers labor turnover, which raises productivity and labor demand. But it’s possible that productivity also rises because the higher minimum attracts more efficient workers to the labor pool. If these new workers are typically more affluent — perhaps middle-income spouses or retirees — and end up taking some jobs held by poorer workers, a higher minimum could harm the truly disadvantaged.
Another reason that employment may not fall is that businesses pass along some of the cost of a higher minimum wage to consumers through higher prices. Often, the customers paying those prices — including some of the diners at McDonald’s and the shoppers at Walmart — have very low family incomes. Thus this price effect may harm the very people whom a minimum wage is supposed to help.
It’s precisely because the redistributive effects of a minimum wage are complicated that most economists prefer other ways to help low-income families. For example, the current tax system already subsidizes work by the poor via an earned-income tax credit. A low-income family with earned income gets a payment from the government that supplements its wages. This approach is very well targeted — the subsidy goes only to poor families — and could easily be made more generous.
By raising the reward for working, this tax credit also tends to increase the supply of labor. And that puts downward pressure on wages. As a result, some of the benefits go to businesses, as would be the case with any wage subsidy. Though this mutes some of the direct redistributive value of the program — particularly if there’s no constraining minimum wage — it also tends to increase employment. And a job may ultimately be the most valuable thing for a family struggling to escape poverty.
What about the macroeconomic argument that is sometimes made for raising the minimum wage? Poorer people typically spend a larger fraction of their income than more affluent people. So if an increase in the minimum wage successfully redistributed some income to the poor, it could increase overall consumer spending — which could stimulate employment and output growth.
All of this is true, but the effects would probably be small. The president’s proposal would raise annual income by $3,500 for a full-time minimum-wage worker. A recent analysis found that 13 million workers earn less than $9 an hour. If they were all working full time at the current minimum — and a majority are not — the income increase from the higher minimum wage would be only about $50 billion. Even assuming that all of that higher income was redistributed from the wealthiest families, the difference in spending behavior between low-income and high-income consumers is likely to translate into only about an additional $10 billion to $20 billion in consumer purchases. That’s not much in a $15 trillion economy.
SO where does all of this leave us? The economics of the minimum wage are complicated, and it’s far from obvious what an increase would accomplish. If a higher minimum wage were the only anti-poverty initiative available, I would support it. It helps some low-income workers, and the costs in terms of employment and inefficiency are likely small.
But we could do so much better if we were willing to spend some money. A more generous earned-income tax credit would provide more support for the working poor and would be pro-business at the same time. And pre-kindergarten education, which the president proposes to make universal, has been shown in rigorous studies to strengthen families and reduce poverty and crime. Why settle for half-measures when such truly first-rate policies are well understood and ready to go? 


Christina D. Romer is an economics professor at the University of California, Berkeley, and was the chairwoman of President Obama’s Council of Economic Advisers.